Radar guide
How to read crypto sector rotation
Follow a sector from its headline return down to the coins driving the move.
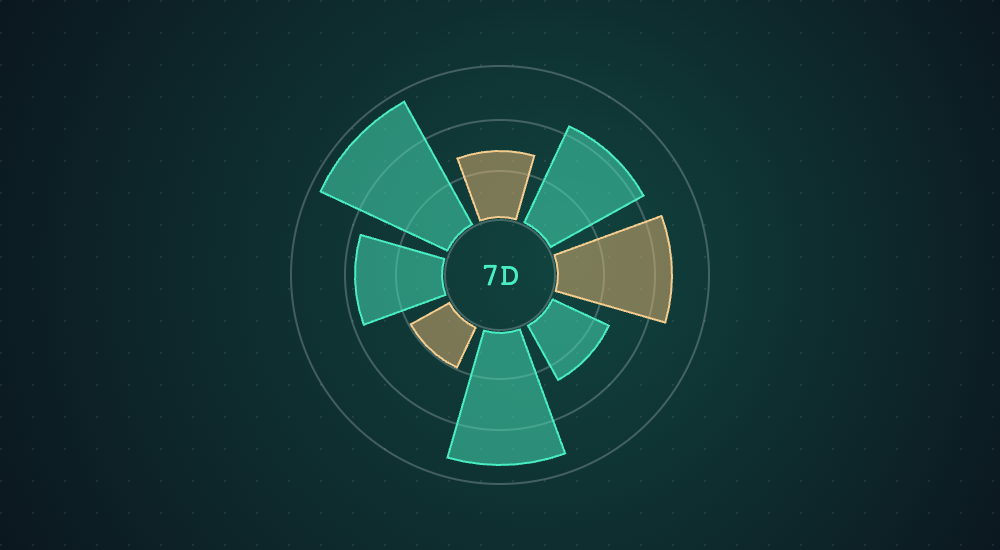
Suppose two sectors on the SM7X Radar show weekly gains of 6% and 2%. Both rose, but the first outperformed the second by four percentage points. That difference is a starting point for studying rotation. Price changes alone cannot tell you whether the same investors sold one group to buy the other.
Start with the time window
Select 7D to compare weekly performance across sectors. Then switch to 24H. A weekly leader can fall behind today because the two windows begin at different prices. Write down both readings before describing a change in leadership.
Look inside the leading sector
Select a sector to see its coins. SM7X requests up to 15 assets ordered by market capitalization and weights their percentage changes by market cap. It excludes designated stablecoins when at least two other assets remain. A heavy weighting can give one asset more influence than several smaller ones combined.
Imagine a sector with two tokens. One carries 80% of the weight and rises 5%. The other carries 20% and falls 5%. The sector still shows a 3% gain.
Check how widely the move is shared
Count the visible coins with positive and negative changes over the same period. Then check the data status. The radar displays an example while live data loads, and individual sectors can be unavailable. Record the window, the live coverage and the largest contributors alongside any comparison.