Exchange trends
Prediction markets on crypto exchanges: what the revenue numbers measure
Coinbase reported a $200 million milestone. Here’s how to distinguish the exchange’s run rate from the money changing hands in a market.
On October 29, 2026, Coinbase reported that its prediction markets had crossed $200 million in annualized revenue. It also reported that the number of daily traders in those markets grew more than 60% from the previous quarter. The first figure measures the pace of a business. The second counts participation. Coinbase Q3 results
Read the time period before the dollar sign
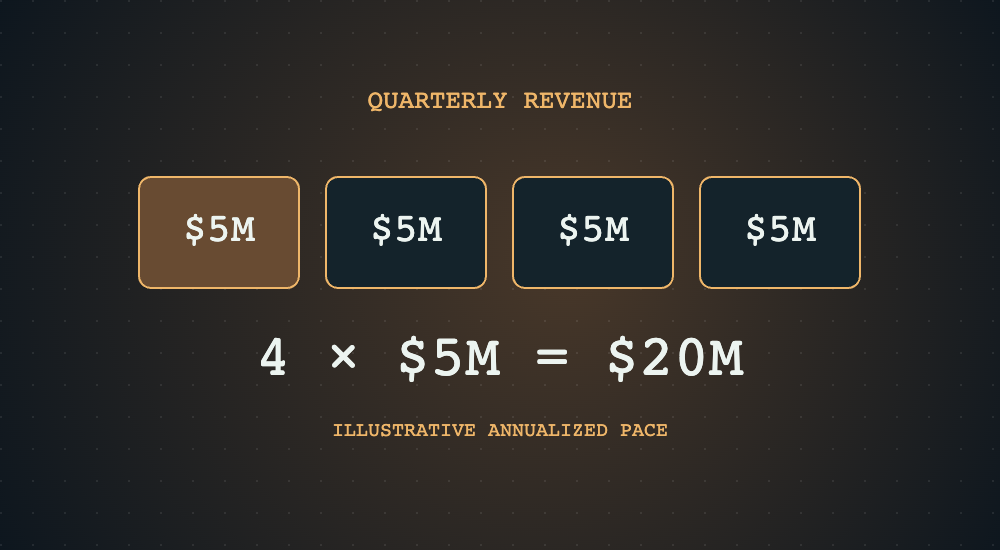
Coinbase’s earnings deck defines the milestone using quarterly annualized net revenue. Imagine a product earns $5 million in one quarter. Multiplying by four gives a $20 million annualized pace. Only the first $5 million has been earned in this example. A busy election or sports calendar could make the next quarter look different. Coinbase earnings presentation, slide 12
What does an event contract measure?
Consider a hypothetical contract that pays $1 if a specified event happens and $0 otherwise. A quoted price of 60 cents describes the price for that outcome under the contract’s settlement rules. Whether the event happens, how much traders exchange, and what the platform earns are three separate questions.
Compare the same metric across exchanges
A dollar of trading volume can be counted each time a contract changes hands. A revenue figure measures what the platform earns. Before comparing two headlines, write down the unit, the time window and the product covered. If one figure is quarterly volume and the other is annualized revenue, those two numbers alone cannot establish which exchange has more traders.